
Preface
The goal of this tutorial series is to allow the reader to start deploying on Kubernetes with a basic understanding of Kubernetes architectural principles. If you don’t know what Kubernetes is or how it works, I highly recommend reading part I of this series.
In this post, we dive into a practical example. We’ll see many of the concepts explained in the first part of the series. This is the structure of the series:
- Part I: Kubernetes basic concepts
- Part II: A practical and realistic example (this post)
- Part III: Best practices
Table of contents
- Introduction
- Provisioning a Kubernetes cluster
- Deploying the application
- Networking between Pods
- Adding persistence
- Recap
- What we didn’t cover
Introduction
The application that we will deploy is a simple web application that, while
minimal, is supposed to mimic a real-world architecture. It exposes two
endpoints, GET /users/:id and POST /users/:id: the former returns the
numeric value associated to a user, if present in the database, and 0
otherwise; the second one increments the value associated to a user. There’s an
additional endpoint, GET /healthz, which simply returns a checkmark and it’s
used to test the connectivity to the application.
For example, the following could be a valid HTTP session, assuming that our application is running on localhost:1323 and that we have HTTPie installed (I prefer it over cURL):
# the GET method is the default one and can be omitted;
# localhost is also the default host
$ http :1323/users/249  # user 249 is not in the database, so we get 0
0
$ http POST :1323/users/249  # we increment the value associated with user 249
1
$ http POST :1323/users/249
2
$ http POST :1323/users/249
3
$ http :1323/users/249
3
$ http :1323/users/32
0
We will not get into the details of how the Go application works, as that is completely orthogonal to the deployment, thanks to containers.
The architecture of this web application is quite simple: an nginx instance proxies all the traffic to a Go web server, which communicates with a Redis instance to store and retrieve data.
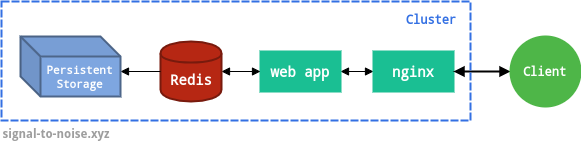
This application is, of course, a contrived example. In this case, an nginx instance isn’t even strictly needed. However, nginx instances (or anything equivalent, for that matter) are frequently used to proxy the actual web applications in real scenarios, so I chose to include it. nginx could also serve static files, if your application needs them.
The code for this web application, as well as the Dockerfiles and the manifest files are available at rubik/kubernetes-tutorial.
Provisioning a Kubernetes cluster
If you would like to follow along, and I highly recommend doing so, you need to be able to connect to a Kubernetes cluster. There are two easy ways.
Google Kubernetes Engine (GKE)
The easiest way, which I recommend for this tutorial, is to create a brand new project on Google Cloud and enable GKE to provision a new Kubernetes cluster. At the end of the tutorial, you can delete the project and all its resources to avoid recurring charges. Note that unless you are enjoying your free tier, you will nonetheless incur charges with this method. On GKE, the master node is managed for free by Google Cloud, but you will pay for the Compute instances you use, as well as for any cloud load balancers you request.
However, if you follow the tutorial and you delete the project when you are done, you should expect charges in the order of a few dollars at most. You can even use Google Cloud’s Pricing calculator to estimate the charges.
If you choose to do this, you will need to take the following steps to prepare your environment:
- install the Google Cloud SDK;
- install the kubectl tool with
gcloud components install kubectl; - create a Kubernetes cluster from the console — note that it may take a few minutes for your cluster to become ready and operational;
- save the cluster credentials on your computer with
gcloud container clusters get-credentials CLUSTER_NAME, whereCLUSTER_NAMEis the name of the cluster you have created in step 3.
You are now ready to follow the tutorial. At the end, don’t forget to clean up by deleting your cluster, any resources associated with it (e.g. load balancers) and your project (if you have created a brand new one for this tutorial).
Minikube
Alternatively, you can also run a single-node cluster on your local machine
with Minikube. Not all features all
supported out-of-the-box — e.g. to expose a load balancer you will need to use
the minikube tunnel command. However, this is a valid alternative if you
don’t want to use GKE.
You will need to take the following steps to prepare your environment:
- install
kubectl— instructions here; - install Minikube — instructions here;
- run
minikube startto create a local cluster.
Deploying the application
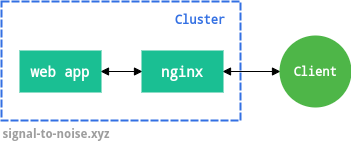
We’ll start by writing the manifest files for the nginx and Go instances. These two components are both completely stateless: these instances don’t need a stable network identity or persistent storage. They could be scaled up and down at any moment without issues.
For these reasons, the Deployment controller is the right abstraction in this case. Let’s create the manifest the nginx instance:
apiVersion: apps/v1
kind: Deployment
metadata:
  name: frontend
spec:
  replicas: 2
  selector:
    matchLabels:
      app: web
  template:
    metadata:
      labels:
        app: web
    spec:
      containers:
      - args: ['nginx', '-g', 'daemon off;']
        image: c1524db4f1/kubernetes-tutorial-frontend:v0.2.0
        imagePullPolicy: Always
        name: nginx
        ports:
        - containerPort: 80
      restartPolicy: Always
This manifest file instructs Kubernetes to create a Deployment called
frontend. Each Pod managed by the Deployment will be created according to the
spec template: it will be built from the image
c1524db4f1/kubernetes-tutorial-frontend:v0.2.0 and will expose port 80.
We specified replicas: 2 for redundancy and availability: our frontend
Deployment will manage two nginx instances. Additionally, we define the restart
policy as “Always”. This ensures that the container will be restarted in all
cases (even if it exists with a success code). We want our nginx instance to be
always up, so that’s the appropriate policy. Other possible values are
OnFailure and Never.
Observe that the spec.selector field is mandatory: the Deployment needs to
know which Pods to manage. In this case, it controls all the Pods with label
app=web. All the Pods created by this spec have that label, as defined by
spec.template.metadata.labels.
The actual application is packaged in the Docker image c1524db4f1/kubernetes-tutorial-frontend, which was created specifically for this tutorial. Similarly, the backend app’s image is c1524db4f1/kubernetes-tutorial-backend.
Let’s submit this manifest file to Kubernetes. We do so by saving the manifest
file to deploy/frontend/20-deployment.yaml and running
$ kubectl apply -f deploy/frontend/20-deployment.yaml
We can check the status of this Deployment with
$ kubectl get deployments
NAME       READY   UP-TO-DATE   AVAILABLE   AGE
frontend   2/2     2            2            4s
The API informs us that the Deployment frontend is up to date, available, and
its Pods are all ready. We can also query the state of all the Pods (by
default, this will only display Pods in the default namespace):
$ kubectl get pods
NAME                        READY   STATUS    RESTARTS   AGE
frontend-557854f87f-924f8   1/1     Running   0           7s
frontend-557854f87f-fvmgb   1/1     Running   0           7s
These Pods have a special name because they were created by the Deployment controller. Their status is Running, so all is fine. Other possible status values are:
- Pending: if the configuration has been accepted by the Kubernetes API, but
one or more containers have not been created; a Pod could remain in Pending
state forever if it cannot be scheduled (e.g. there are no available nodes or
ports) — more details are found with the command
kubectl describe pod <pod name>; - Success: if all containers in the Pod have terminated successfully, and will not be restarted;
- Failure: if at least one container in the Pod has terminated in failure, i.e. it exited with a non-zero exit code or it was forcefully terminated by the system;
- Unknown: if the state of the Pod is not known to the control plane; this could indicate the presence of communication issues.
Deployment updates
Finally, let’s consider Deployment updates. If we make changes to the manifest
file, we can push the update with kubectl apply -f <manifest-file>.
Kubernetes will compare the old version with the new one and, if it finds any
differences, it will take steps to reach the desired state.
If we update the image version, for example, the Deployment controller will create a new set of Pods with the new container image, and will gradually scale up the new replica set. At the same time, it will scale down the replica set with the previous version. This update strategy is called RollingUpdate. There are other strategies available. Notably, the Recreate one, which is quite handy during development. It consists in terminating all the running instances and then recreating them with the newer version.
While the RollingUpdate strategy can prevent downtime, if configured
appropriately, that’s not possible with the Recreate one. Let’s configure
our update to prevent downtime. We’ll add the following configuration to the
spec object:
strategy:
  type: RollingUpdate
  rollingUpdate:
    maxSurge: 1
    maxUnavailable: 0
With the above parameters, the frontend Deployment will create one additional Pod during the update and it will ensure that no Pods are unavailable at any time. Additional update strategies are discussed here.
Heads up The pods in the old replica sets are terminated and the traffic switches to the new pods when they are ready. But how does Kubernetes know when the new pods are ready to accept traffic? Actually, it doesn’t, and it will consider the new pods ready as soon as the container process starts. Of course, that is rarely the desired behavior, so we can instruct Kubernetes to poll the pods periodically to determine if they are ready or not, alive or not. That is accomplished by setting up health checks.
Final configuration
With those improvements, the configuration for our frontend Deployment looks like this:
apiVersion: apps/v1
kind: Deployment
metadata:
  name: frontend
spec:
  replicas: 2
  strategy:
    type: RollingUpdate
    rollingUpdate:
      maxSurge: 1
      maxUnavailable: 0
  selector:
    matchLabels:
      app: web
      service: nginx
  template:
    metadata:
      labels:
        app: web
        service: nginx
    spec:
      containers:
      - args: ['nginx', '-g', 'daemon off;']
        image: c1524db4f1/kubernetes-tutorial-frontend:v0.2.0
        imagePullPolicy: Always
        name: nginx
        ports:
        - containerPort: 80
      restartPolicy: Always
After submitting the manifest with
$ kubectl apply -f deploy/frontend/20-deployment.yaml
we see that the number of Pods immediately increases to three (due to
maxSurge: 1). When the new Pod is ready, Kubernetes starts terminating the
old Pods and creating new ones. This process happens gradually one by one,
because we specified maxUnavailable: 0, which forces Kubernetes to maintain
two fully ready Pods at any time (as we set replicas: 2). Had we specified
maxUnavailable: 1, Kubernetes would have upgraded two Pods at a time.
For our application, we’ll create a similar Deployment manifest. It is
essentially the same, so we will not discuss it in detail. We save the
following configuration in deploy/backend/20-deployment.yaml:
apiVersion: apps/v1
kind: Deployment
metadata:
  name: backend
spec:
  replicas: 2
  strategy:
    type: RollingUpdate
    rollingUpdate:
      maxSurge: 1
      maxUnavailable: 0
  selector:
    matchLabels:
      app: web
      service: app
  template:
    metadata:
      labels:
        app: web
        service: app
    spec:
      containers:
      - args: ['/bin/app']
        image: c1524db4f1/kubernetes-tutorial-backend:v0.3.0
        env:
          - name: REDIS_URL
            value: redis:6379
        imagePullPolicy: Always
        name: app
        ports:
        - containerPort: 1323
      restartPolicy: Always
This manifest is almost identical to the previous one, with the only
differences being the container image and command, and the env field. As the
name implies, the env field allows us to inject environment variables inside
the container. In this case, we specify the variable REDIS_URL which we will
need later.
After deploying, this is the output of kubectl get pods:
NAME                        READY   STATUS    RESTARTS   AGE
backend-78d87dd74b-pk7tr    1/1     Running   0          14m
backend-78d87dd74b-wth2f    1/1     Running   0          14m
frontend-59f5cf4948-96drd   1/1     Running   0          23m
frontend-59f5cf4948-gcrll   1/1     Running   0          23m
We didn’t deploy those Pods directly. Instead, they are managed by the
Deployment controllers. We can inspect the currently active deployments by
running kubectl get deployments:
NAME                        READY   UP-TO-DATE   AVAILABLE   AGE
frontend                    2/2     2            2           23m
backend                     2/2     2            2           14m

Networking between Pods
We are now ready to set up the Services that will allow our Pods to communicate. We will create a LoadBalancer Service for the nginx Pods, since they need to be reached from outside the cluster, and a ClusterIP Service for the Go application. If you need to, you can refresh your knowledge about Kubernetes Services here.
This is the manifest file that declares the LoadBalancer Service for our nginx Pods:
apiVersion: v1
kind: Service
metadata:
  name: nginx
spec:
  type: LoadBalancer
  ports:
  - name: "80"
    port: 80
    targetPort: 80
  selector:
    app: web
    service: nginx
This manifest specifies that the Service is a LoadBalancer and that it needs to
forward traffic from port 80 (port), to port 80 (targetPort) of the
selected Pods. We select Pods that have the labels app: web and service: nginx, which are the same ones we used in the nginx Deployment.
As before, we save this manifest to deploy/frontend/30-service.yaml and
submit it to the Kubernetes API with
$ kubectl apply -f deploy/frontend/30-service.yaml
As mentioned above, for the Go application we’ll deploy a ClusterIP Service. That’s because it’s proxied by nginx, so all its traffic comes from inside the cluster. The manifest file is quite simple like the previous one:
apiVersion: v1
kind: Service
metadata:
  name: app
spec:
  type: ClusterIP
  ports:
  - name: "1323"
    port: 1323
    targetPort: 1323
  selector:
    app: web
    service: app
We save it in deploy/backend/30-service.yaml and deploy it:
$ kubectl apply -f deploy/backend/30-service.yaml
We can inspect the status of the running Services (again, in the default
namespace, which is the one we’re working with) with the following command:
$ kubectl get svc
NAME         TYPE           CLUSTER-IP      EXTERNAL-IP   PORT(S)        AGE
app          ClusterIP      10.97.226.151   <none>        1323/TCP       1m10s
nginx        LoadBalancer   10.97.210.57    <pending>     80:31494/TCP   1m14
As we can see, the ClusterIP has no external IP, while the LoadBalancer shows
“pending”. That’s because my cluster is local and runs through Minikube. If we
were communicating with a cloud Kubernetes installation (e.g. GKE), the load
balancer would be provisioned automatically and the external IP would appear
after a few seconds. In this case, however, we need to run minikube tunnel
in a separate shell in order to obtain an external IP. After launching that
command separately, we can check the status of our Services again:
$ kubectl get svc
NAME         TYPE           CLUSTER-IP      EXTERNAL-IP    PORT(S)        AGE
app          ClusterIP      10.97.226.151   <none>         1323/TCP       1m24s
nginx        LoadBalancer   10.97.210.57    10.97.210.57   80:31494/TCP   1m28s
We can now test the connectivity to our application:
$  http 10.97.210.57/healthz
HTTP/1.1 200 OK
Connection: keep-alive
Content-Length: 3
Content-Type: text/plain; charset=UTF-8
Date: Sun, 24 Nov 2019 18:02:31 GMT
Server: nginx/1.17.5

✓
This response is generated by our Go application, which in turn is proxied by
the nginx instances. This is a good point to learn about a new command:
kubectl logs. It allows us to read the logs produced by our Pods:
$ kubectl logs frontend-99d9cfbc9-dbbdj
192.168.99.1 - - [24/Nov/2019:18:02:31 +0000] "GET /healthz HTTP/1.1" 200 3 "-" "HTTPie/1.0.3"
$ kubectl logs frontend-99d9cfbc9-dknvq
$
As we can see, our request was routed through the Pod
frontend-99d9cfbc9-dbbdj, while the other Pod hasn’t served any traffic yet.
We can fetch the output of our backend pods too, although the Go application is
configured not to log accesses, so we only see the program start output:
$ kubectl logs backend-78d87dd74b-pk7tr

   ____    __
  / __/___/ /  ___
 / _// __/ _ \/ _ \
/___/\__/_//_/\___/ v3.3.10-dev
High performance, minimalist Go web framework
https://echo.labstack.com
____________________________________O/_______
                                    O\
⇨ http server started on [::]:1323
Adding persistence
The cluster is now functional, but to make the tutorial more realistic we are going to add persistence through Redis. That will enable us to call the users endpoints which we described at the beginning of the post.
Before deploying the Redis container, we will take care of storage. In Kubernetes, storage resources are represented by PersistentVolume objects. These resources are consumed by PersistentVolumeClaim objects, just like Pods consume node compute resources. Therefore, we start by deploying the following PersistentVolumeClaim:
apiVersion: v1
kind: PersistentVolumeClaim
metadata:
  labels:
    service: redis
  name: redis-data
spec:
  accessModes:
  - ReadWriteOnce
  resources:
    requests:
      storage: 10Gi
In the above specification, there are two important configuration options.
The access mode describes how the volume is mounted; the possible values are:
ReadWriteOnce– the volume can be mounted as read-write by a single nodeReadOnlyMany– the volume can be mounted as read-only by many nodesReadWriteMany– the volume can be mounted as read-write by many nodes
Not every storage provider supports all the access modes. E.g. an
awsElasticBlockStore
volume only supports ReadWriteOnce, whereas a
gcePersistentDisk
supports both ReadWriteOnce and ReadOnlyMany. Importantly, a volume can
only be mounted using one access mode at a time, even if it supports many.
The resources request specifies how much storage we request — we ask for 10GB in this case. If in the future we need more storage, we can request a larger volume for a PersistentVolumeClaim by editing the configuration and applying it again. Kubernetes will resize the existing volume instead of creating a new PersistentVolume. Currently, one can only resize volumes containing a filesystem if the filesystem is XFS, ext3 or ext4.
We save the PersistentVolumeClaim configuration in
deploy/redis/10-persistentvolumeclaim.yaml and we apply it with the usual
command:
$ kubectl apply -f deploy/redis/10-persistentvolumeclaim.yaml
We can verify that the volume was provisioned by inspecting the volume claims and the volumes:
$ kubectl get pvc
NAME         STATUS   VOLUME                                     CAPACITY   ACCESS MODES   STORAGECLASS   AGE
redis-data   Bound    pvc-75fc6d82-7b14-40b5-beb3-e50c6015323a   10Gi       RWO            standard       30s
The STATUS column indicates that the claim is bound to a volume, which is
shown in the VOLUME column. We can request information about that particular
volume as follows:
$ kubectl get pv pvc-75fc6d82-7b14-40b5-beb3-e50c6015323a
NAME                                       CAPACITY   ACCESS MODES   RECLAIM POLICY   STATUS   CLAIM                STORAGECLASS   REASON   AGE
pvc-75fc6d82-7b14-40b5-beb3-e50c6015323a   10Gi       RWO            Delete           Bound    default/redis-data   standard
Note that the RECLAIM POLICY is set to Delete. That means that if the
PersistentVolumeClaim is deleted, Kubernetes will remove both the Volume it is
bound to, as well as the associated storage asset. The other option is
Retain. With this mode, the PersistentVolume object will not be deleted, but
the volume will be considered “released”. The cluster administrator will need
to perform manual
reclamation
of the resource.
We are finally ready to deploy Redis with persistence enabled. Since our Redis instance needs to sync to persistence storage, it’s a stateful application. The correct abstraction for this kind of application is the StatefulSet controller. Like a Deployment controller, it takes care of managing Pods in a ReplicaSet. However, Pods controlled by a StatefulSet are not interchangeable: each Pod has a unique identifier that is maintained no matter where it is scheduled.
Heads up All replicas of a Deployment share the same PersistentVolumeClaim. Since the replica Pods created are identical to each other, only volumes with modes ReadOnlyMany or ReadWriteMany can work in this setting. Even Deployments with one replica using a ReadWriteOnce volume are not recommended. This is because the default Deployment strategy will create a second Pod before bringing down the first pod on a recreate. The Deployment may fail in a deadlock as the second Pod can’t start because the ReadWriteOnce volume is already in use, and the first Pod won’t be removed because the second Pod has not yet started. Instead, it’s best to use a StatefulSet with ReadWriteOnce volumes, which is what we are doing in this case even if we only have a single Redis instance.
A StatefulSet is configured almost identically to a Deployment:
apiVersion: apps/v1
kind: StatefulSet
metadata:
  name: redis
spec:
  selector:
    matchLabels:
      service: redis
  serviceName: redis
  replicas: 1
  template:
    metadata:
      labels:
        service: redis
    spec:
      containers:
      - name: redis
        image: redis:6.0.3-alpine
        args: ["--appendonly", "no", "--save", "300", "1", "--save", "30", "1000"]
        ports:
          - containerPort: 6379
            name: redis
        volumeMounts:
        - mountPath: /data
          name: redis-data
      volumes:
      - name: redis-data
        persistentVolumeClaim:
          claimName: redis-data
Notably, we declare the volume redis-data, bound to the PersistentVolumeClaim
redis-data, which is mounted at /data. The redis Docker image stores data
at /data by default. The additional arguments in args just instruct Redis
to save data at a certain frequency. The above configuration is saved in
deploy/redis/20-statefulset.yaml and applied with the usual command
$ kubectl apply -f deploy/redis/20-statefulset.yaml
Finally, we need to deploy a Service to ensure that our Redis instance can be reached. Since it only has to communicate with Pods inside the cluster, a ClusterIP Service is sufficient:
apiVersion: v1
kind: Service
metadata:
  name: redis
  labels:
    service: redis
spec:
  type: ClusterIP
  selector:
    service: redis
  ports:
  - port: 6379
    targetPort: 6379
We call the Service redis, so that it can be reached by our backend
application (recall that we defined the environment variable REDIS_URL).
Finally! The cluster is now fully functional.
We can test the application behavior by calling the /users endpoints:
$ http 10.103.127.182/healthz
✓
$ http 10.103.127.182/users/10  # user 10 does not exist, we get 0
0
$ http 10.103.127.182/users/10  # user 10 does not exist, we get 0
0
$ http POST 10.103.127.182/users/10  # increment user 10
1
$ http 10.103.127.182/users/10  # now we get 1
1
$ http POST 10.103.127.182/users/10  # increment user 10 again
2
$ http POST 10.103.127.182/users/10  # ...
3
$ http POST 10.103.127.182/users/10
4
$ http 10.103.127.182/users/10
4
Remember that we are querying the external IP that we read from kubectl get svc (and running minikube tunnel as well).
Aside: DNS resolution within the cluster
You might be asking yourself, how does the backend app find the Redis Service
IP? This is a good question. Kubernetes offers a DNS cluster addon Service
that runs as the kube-dns Service in the kube-system namespace. You can check
if your cluster is running kube-dns by running the following command:
$ kubectl get svc -n kube-system
NAME       TYPE        CLUSTER-IP   EXTERNAL-IP   PORT(S)                  AGE
kube-dns   ClusterIP   10.96.0.10   <none>        53/UDP,53/TCP,9153/TCP   2h
If this Service is running, then it automatically assigns a DNS record to each Service name. Otherwise, the default A/AAAA record format for a Service is
{service name}.{namespace}.svc.{cluster domain}
where the default value for {cluster domain} is usually cluster.local. We
can test the DNS resolution from a Pod with nslookup:
$ kubectl exec -it backend-78d87dd74b-pk7tr -- nslookup redis
nslookup: can't resolve '(null)': Name does not resolve

Name:      redis
Address 1: 10.97.34.93 redis.default.svc.cluster.local
Do not pay attention to the first line of the nslookup output. It’s a
weirdly-worded message that doesn’t actually indicate an
error. The output tells us that
indeed, the redis name resolves to 10.97.34.93, which is the ClusterIP of the
Redis Service.
Recap
- We created Deployments and StatefulSets to deploy the application layer, Services to implement networking between Pods and a PersistentVolumeClaim to configure storage.
- We mentioned health checks, which should always be implemented and configured.
- We briefly touched on the topic of DNS resolution.
- Throughout the tutorial, we used several useful
kubectlsubcommands:kubectl apply,kubectl get,kubectl describe,kubectl logs.
What we didn’t cover
- If you don’t want to use a managed solution like Google Kubernetes Engine
(GKE) or Amazon Elastic Kubernetes Service (EKS), you will have to set up
Kubernetes yourself on VMs or bare metal, and that is not simple. If you are
interested, I recommend you read the
kubeadmdocumentation or the excellent Kubernetes The Hard Way series by Kelsey Hightower. - We defined the environment variable
REDIS_URLdirectly in the backend Deployment configuration. When the configuration gets bigger, it’s best to useConfigMaps. - We didn’t cover Ingresses or TLS termination. Personally I find the nginx Ingress controller and cert-manager quite powerful and easy to setup. Cert-manager handles the provisioning and renewal of Let’s Encrypt certificates automatically.
- If your Kubernetes cluster is accessed by multiple users, you should configure role-based access control (RBAC).
Conclusion
In this second part we deployed an toy application that resembled a real-world one. I encourage you to start experimenting with your applications. Before you begin, you may want to take a look at some best practices, so that you can form good habits from the start. I also recommend taking a look at some useful tools that make working with Kubernetes easier and more efficient.